Retrospective Surveillance of Chemical Incidents
Data Analytics Data Visualization Design and Development Interview
Sketching Tableau Axure HTML CSS D3.js JQuery Bootstrap MySQL PHP
OVERVIEW
During this internship at Pacific Northwest National Laboratory (PNNL), I worked with 2 developers to design and develop a chemical surveillance web application to facilitate retrospective analysis.
Our application provides a method which support a complete analysis flow from location based overview to chemical trend detail.
Our design was considered to be the best visualization design in a multi-team competition and selected to be integrated into a large production surveillance system.
I was responsible for the whole web interface and data visualization design to explore trend and pattern in GBs of data and customized D3.js interactive graphs using front end technologies.
Only limited information is discussed below due to the Non-Disclosure Agreement (NDA).
UNDERSTANDING THE PROBLEM SPACE
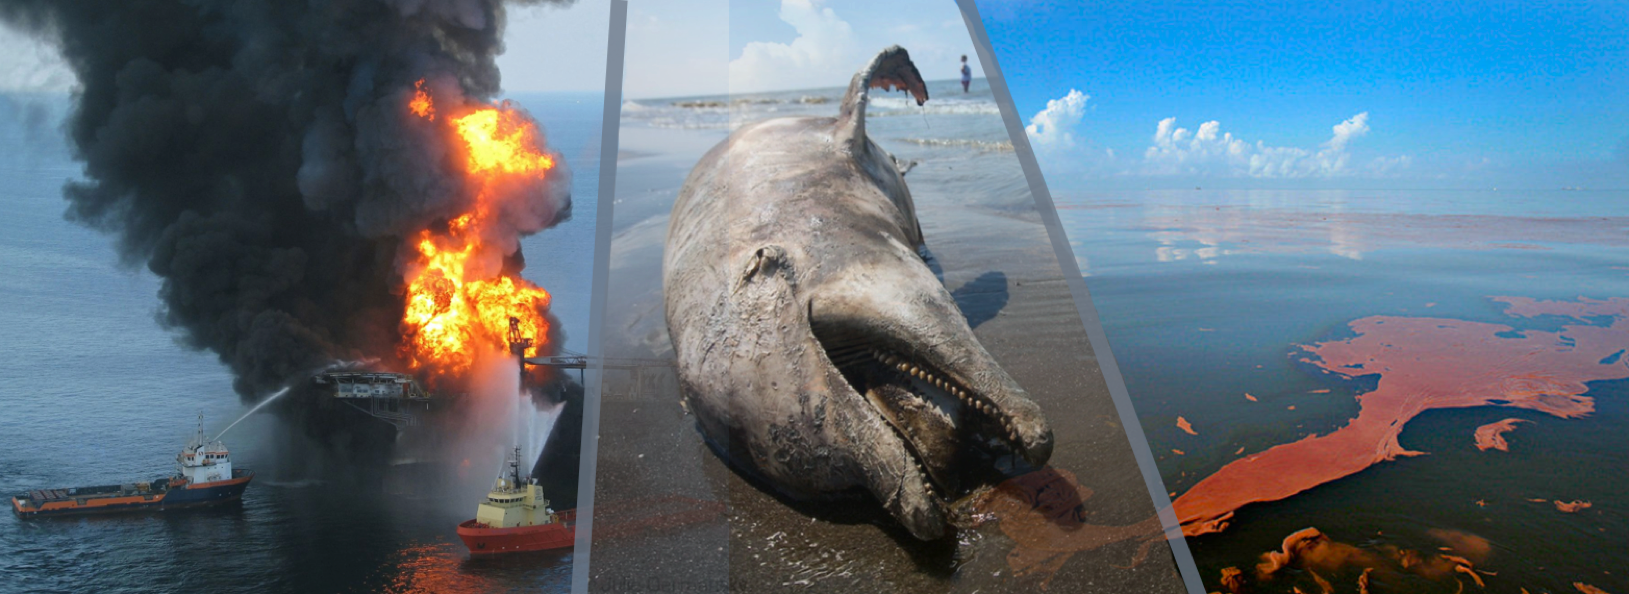
Explosion, oil spill, volcano, chemical leak, fire... a lot of accidents happened each year, which have caused environment pollution, and have negative influence on both animals and humans.
So what can we do to help with this situation? How can we make it under control? How to better utilize the chemical incident datasets we have?
To solve this problem, I started with collecting the general needs from the project sponsor, their domain experts,
and conducted research about the area of chemical surveillance.
According to the research of some famous incidents, we had a clear picture about the features and effects of those chemical related incidents.
From the related News, we also learned which information is important for the professionals and the public.
Then I collaborated with our developers to get data from some national databases to explore what data dimensions are usually provided and how detailed the data could be.
After a thorough discussion with our sponsor and experts, we obtained a clear picture of the problem.

So, what can be done? Retrospective Analysis!!
Our RetroSpect: A visual analytical tool for experts to perform “retrospective analysis” and “monitoring” on chemical incidents.

DESIGN & DEVELOPMENT
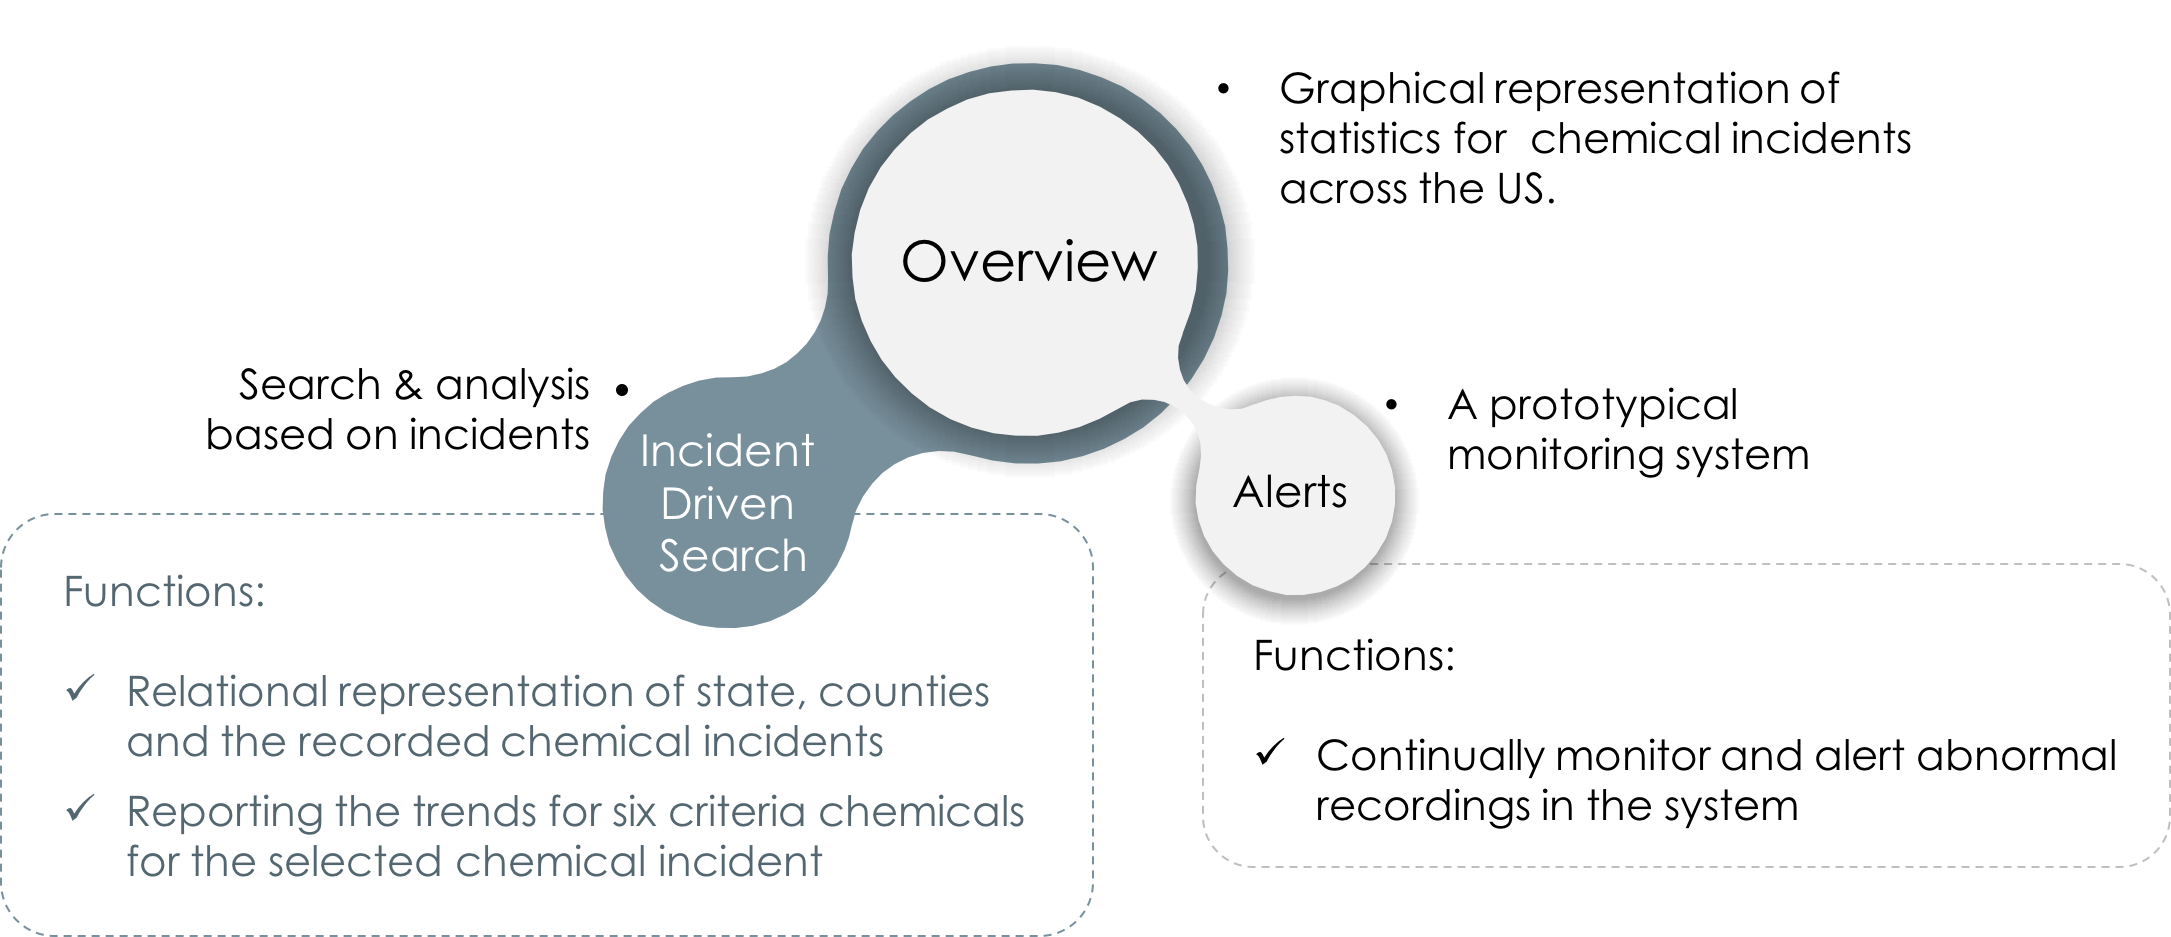
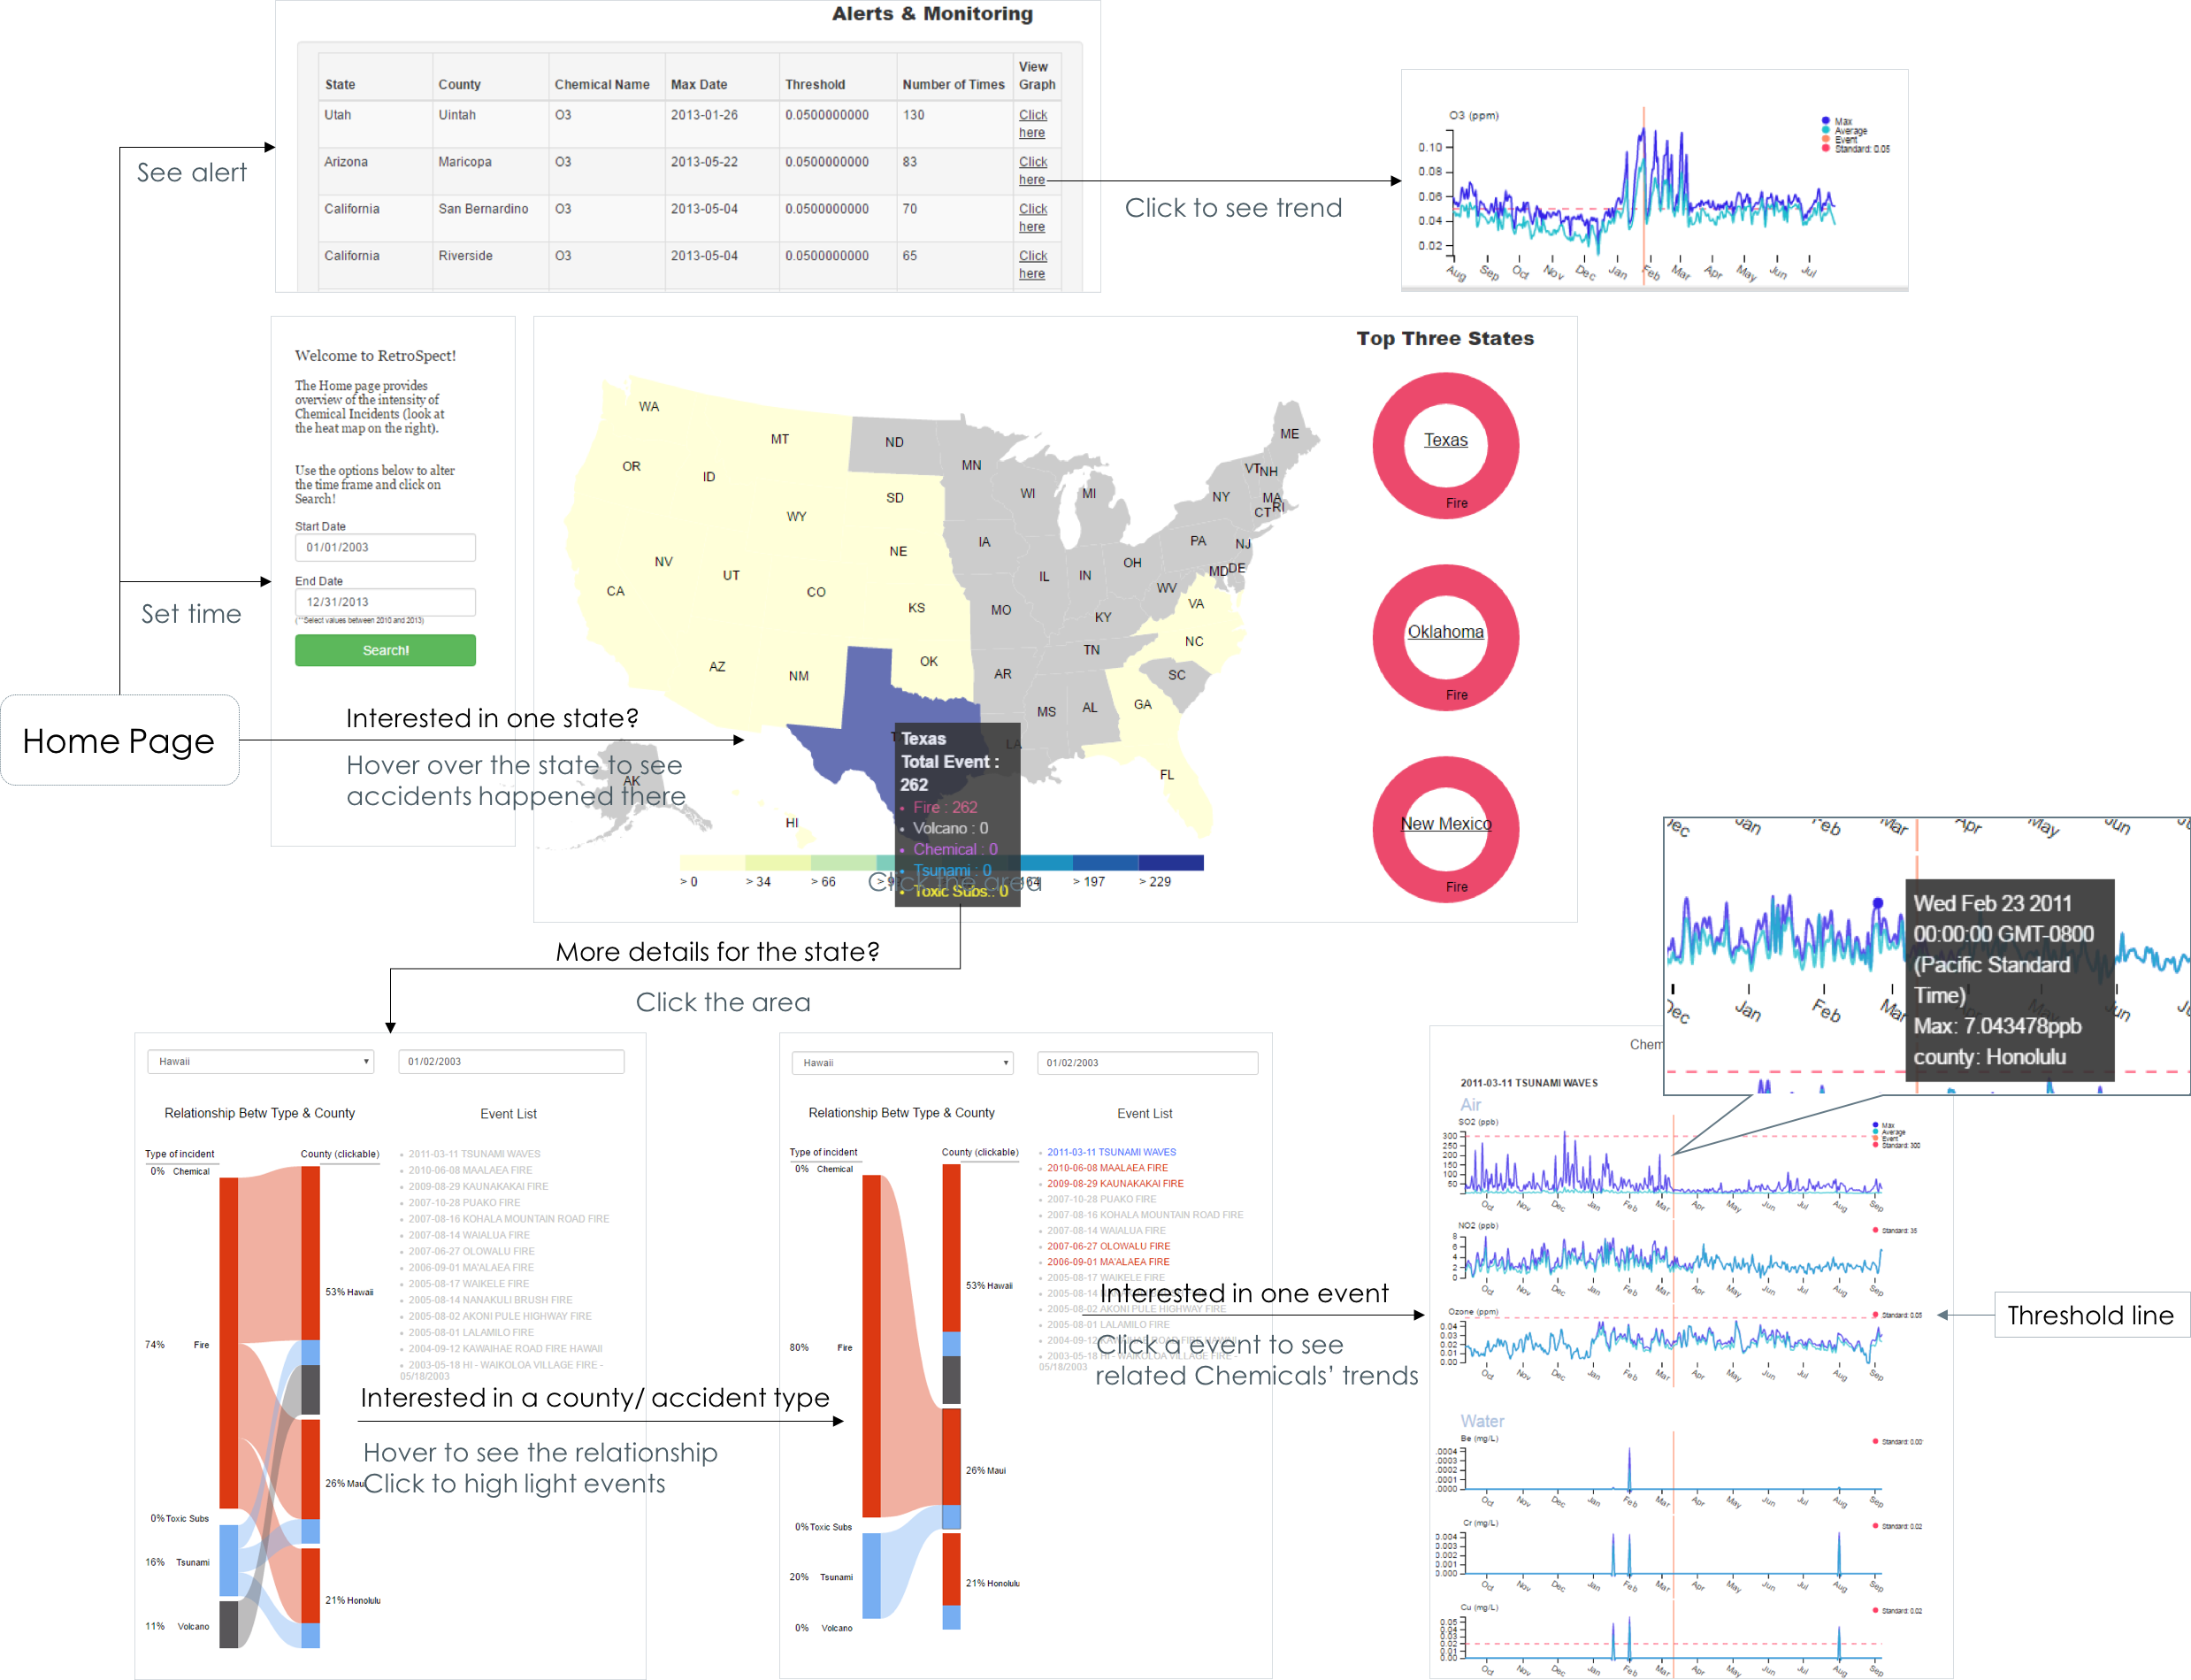
Based on the design goals and features of the datasets, I found that location(states), types of incidents, chemical spread trend (time & location), vibration of chemical concentration, alert of abnormal condition are important. After studied some other web applications in this field, we decided to provide users with a location based incident overview first. Then users can click to explore an area where they are interested to find incidents’ information. For any incident they selected, trend of related chemicals will also be provided. User can also quickly access to most recent incident alert and have a shortcut to see the related trend in our alert section. To provide better flexibility to explore relationships, time filter and clickable BiPartite chart were applied. I also took care of the detail design.For example, I provided a threshold line of chemicals to help users notice abnormal conditions easily. The system structure:
To provide a fluently workflow, I started from sketching several types of chart and layout.
During the design review process, I invited two intern developers on my team to talk about their opinions of the App based on their understanding of data.
The design was also reviewed by stakeholders, some senior designers in PNNL, and updated iteratively.
Because of the NDA, the sketches and the interactive prototype built by Axure cannot be shown here.
The final interfaces are shown as follow:
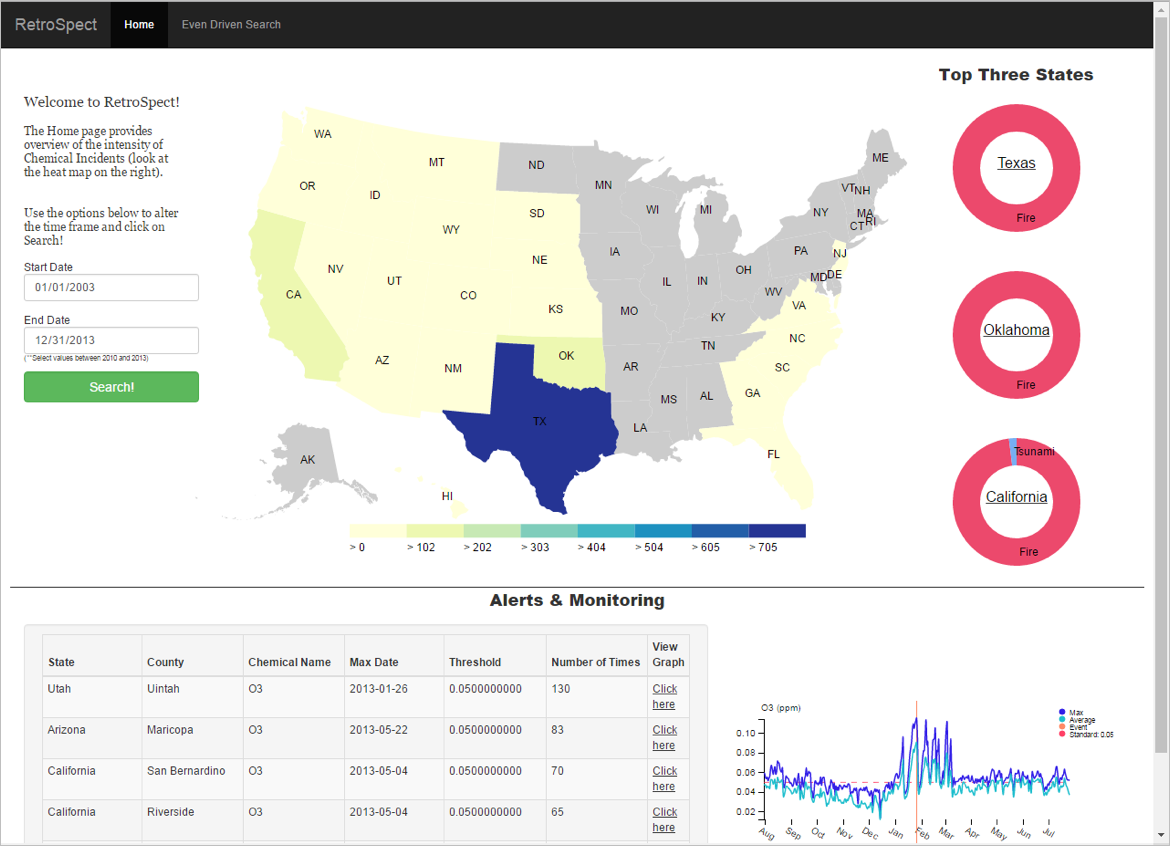
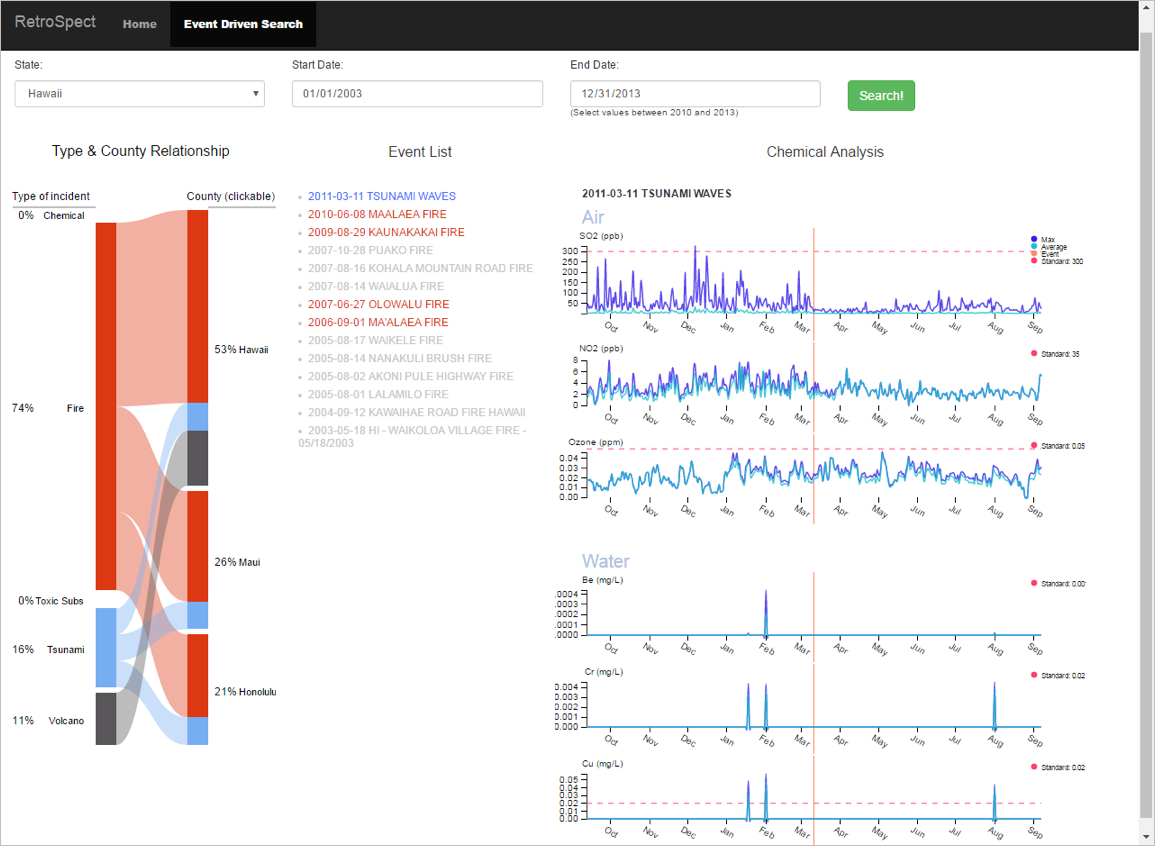
Our application provides:
- Multiple functions for overview to detail analysis
- Suitable visualization graphics to show different features of the data
- Intent-driven interaction design tailored for the analytical tool
- Detailed design
Let's see the main interactions.
EASY UPGRADES & FUTURE WORK
Our team presented our Application to our sponsor and senior designer in PNNL. This visualization design was highly praised. And we also pointed out some easy upgrades for the current design.
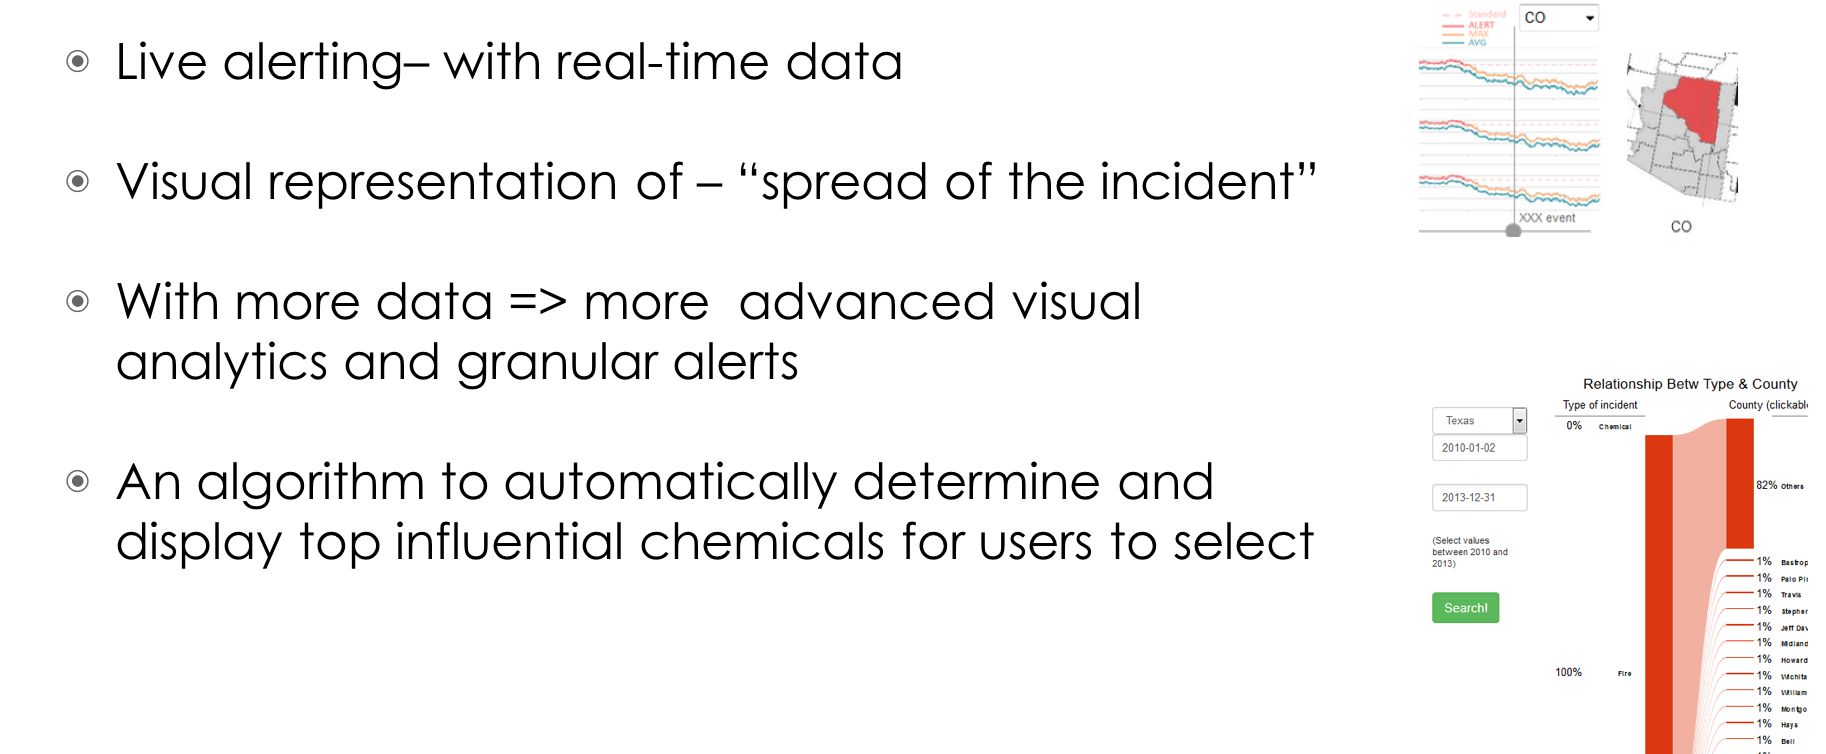
What’s more, from my point of view, this app could not only be a retrospective app. If we applied machine learning algorithm to the trend of chemicals in the line chart, it could be a powerful prediction tool. If we have real time data, this app could also be a monitoring tool. If I had more time during the process, I would also like to invite some domain experts to use our web application to do a usability test. I think this would provide us valuable points to improve the app.