Visual Analytics Science and Technology Challenge 2015: CrowdAnalyzer
Data Visual Analytic & Visualization Design Canvas.js D3.js php

CHALLENGE QUESTION
Go to Offical Site of VAST 2015
Characterize the movement of groups and individuals in the DinoFun World(amusement park), with a special emphasis on what might be relevant to better understanding the incident that occurred in June 2014.
OUR SOLUTION
CrowdAnalyzer is a VA system designed to visualize and analyze tourists' movement data in a theme park.
It is a collaborative effort from visual analytics and statistical analytic strategies.
The system can not only monitor individual's activities and abstract them into groups in the park, but also gains insights of tourists' behavior patterns for better service improvement, and inspects potential abnormal incidents.
PROCEDURE
Data cleaning--> Data analysis--> Design & Development--> Refinement
CHART TYPES
Small multiples; Map; Tree map; Parallel Coordinates
MY WORK WITHN THE TEAM
My work is main focused on designing and building Facility Manager tab, and also include some programming work for other tabs. MySQL, PHP, HTML5 and JavaScript are used to build this system.
INTRODUCTION OF THE FACILITY MANAGER
-
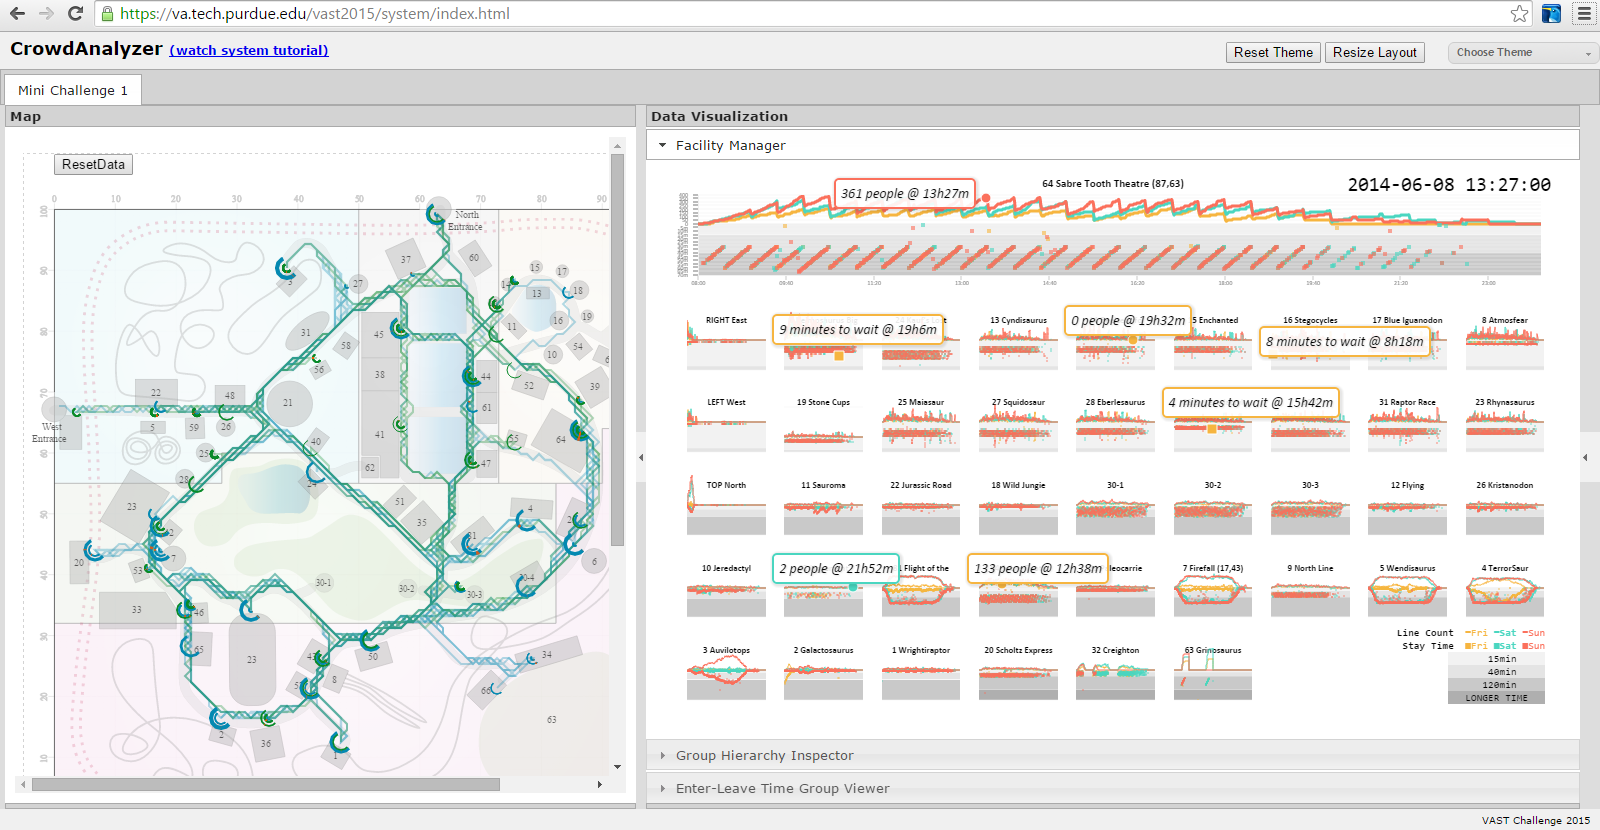
Small multiples are used to visualize each ride's three-day check-in data, showing an overview of operational status of different facilities in the park.
- Friday, Saturday and Sunday were coded into three different colors.
- On click of one small diagram, an enlarged diagram would show on the top of the space, providing the opportunity to study more detailed data of three days.
- Line graph on top shows the amount of people at the check-in location at different time.
- Scattered points below represents an individual's waiting time to check into the location.
- We use different gray bands to show different scales as the waiting time varies much in a large range.
- By clicking on one scattered point, the individual's activity pattern, including movement path, check-in time and location would show on the map viewport on the left.